![]()
 Time spent watching Red Skelton, the Honeymooners, and even Churchill’s funeral with Grandpa Roy planted lasting memories of a black and white world. But the world was never truly black and white, and discerning the colors of today’s global economic and investment universe is complex1.
Halfway through 2018, while the US economy apparently gets hotter, the foreign markets appear to be cooling, unlike last year when every market in the world went up. It is unusual for global markets to all rise or fall at the same time. Typically, some market, somewhere in the world, behaves differently. So, this year’s divergence is the more normal pattern.
However, there is a correlation between the US and the world markets. Statistically, about one fourth of international market movements can be attributed to what’s happening in America, and vice versa2. Last year saw uniform gains, but this year the USA is up, slightly, while all the major world indexes are down.
Good US earnings and a stronger dollar compound the difference, while tariff and trade talks confuse the situation. Low trading volumes indicate limited commitment on any direction the market might take. US Gross Domestic Product (GDP) is up about 3%, considerably higher than its 2.2% average since the great recession of 2008, and expectations for an unusually large quarterly increase in the next report are high.
Consumer finances are in excellent shape. Debt remains well below pre-recession averages, while household net worth continues to climb to new all-time highs. Vehicle sales remain about 1 million units above average, while housing starts at 1.35 million units are finally above their 20-year average rate of 1.3 million.
US corporate profits are soaring. This quarter and the last are the only two times over the past 30 quarters when analysts increased earnings estimates during the quarter, suggesting another very strong earnings season. Over time, stock prices tend to follow profits. The US stock market as measured by the S&P 500 Index remains in positive territory, year-to-date up less than 2% as of June 30, despite being about 5% below its all-time-high set January 26.
American stock price to earnings (P/E) valuations, at 16.3, stand very near historic averages. If earnings continue climbing, as expected, either stock prices will also rise, or the P/E ratio will fall, improving the valuations.
Conversely, foreign developed and emerging markets through June 30 are down for American investors. Most foreign stock valuations are somewhat “cheap” or below their average market valuations. The dollar’s slight strengthening against the major currencies plays a part, but according to the Wall Street Journal, growth sentiments following May’s data reports for Europe and China both soured during the second quarter.3
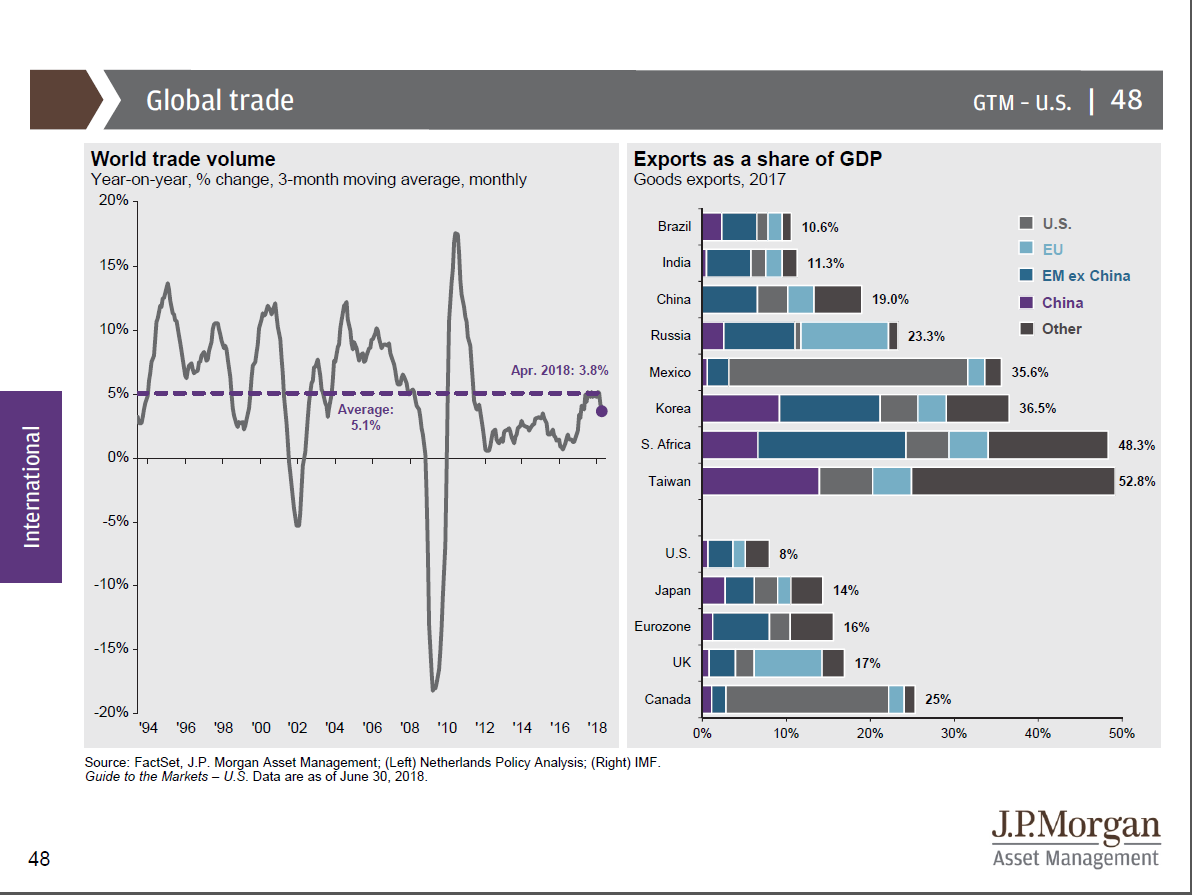
The difference between the USA and the rest of the world might have something to do with international trade. Only 8% of American GDP is attributable to exports. Exports represent much larger percentages of the rest of the world economies: from the mid-teens in Europe to over half in Taiwan. While all these countries export to us, only our NAFTA neighbors are particularly dependent on trade with us. The clear majority of Canada’s 25% and Mexico’s 35.6% of export-dependent GDP is to the USA.
America remains the world’s largest economy, at about $19 Trillion, and represents slightly more than half of the investment universe. Our exports of about $1.5 Trillion are about the size of the entire economies of either South Korea, Russia, or Canada4. Addressing the trade imbalance, Gabriela Santos of JP Morgan Asset Management describes the USA as “mostly a closed economy, they need us more than we need them.”
Unlike many of the world’s economies, the US is stronger than most Americans understand. While there is a recession in the future, it isn’t likely to be nearly as severe as the two most recent downturns. But most economists believe we have at least another year of expansion before conditions sour. If that is right, this expansion would become the longest in history.
Something will trigger a downturn, sometime in the future. That much is certain. But it is beginning to look more like the next economic slowdown could become a traditional cyclical recession rather than another global panic as we saw in the two most recent recessions.
Of course, the barrage of colorful tweets adds momentary uncertainty to whatever issue they address. Oil prices remain volatile, trade tensions could explode, sudden unexpected changes to monetary policy, or new fiscal policy initiatives could trigger unexpected consequences leading to market downturns.
In the short run, the markets do not like uncertainty, but as mentioned above, in the long run, stock prices tend to follow company earnings. And for the foreseeable future, green for growth appears the dominate color.
As always, contact us to review your investment portfolio and help keep it aligned with your investment goals and time horizon.
The opinions voiced in this material are for general information only and are not intended to provide specific advice or recommendations for any individual. All performance referenced is historical and is no guarantee of future results. All indices are unmanaged and may not be invested into directly.
Tracking #1-753280
___________________________
1Except as noted, information provided by JP Morgan Asset Management’s 3Q 2018 “Guide to the Markets” and comments from Dr. David Kelly and Gabriela Santos of JPM during a conference call on July 3, 2018 highlighting the guide as of June 30, 2018.
2As implied by a correlation coefficient of 0.5 of 30 countries.
3https://www.wsj.com/articles/strong-spending-data-shows-u-s-economy-chugging-ahead-of-europe-and-asia-1528994914?mod=searchresults&page=1&pos=9
4https://en.wikipedia.org/wiki/List_of_countries_by_GDP_(nominal)