![]()
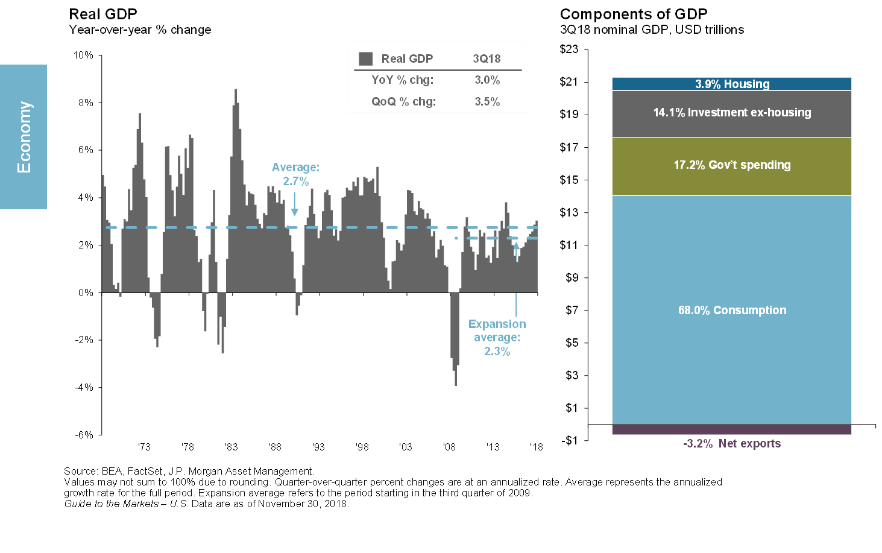
 I don’t run as fast as I was able thirty years ago, and neither should we expect the economy to grow at the same rates it increased three decades ago. The current economic expansion could become the oldest in history if we avoid a recession before next July.1
In the 1990s we experienced the longest economic expansion on record, and it was preceded by and separated from the third-longest expansion by an incredibly mild, eight-month recession ended in March 1991. Disruptive legislation, FED policy mistakes, and the 1990 oil price shock are blamed for causing that recession.
Despite my age, I’m still finishing near the front of most races, partly because I’ve learned how to respond to injury. Minor aches, pains, and sluggish legs can heal by doing easy running, while more severe issues require rest and possibly therapy. Stock market corrections are also unavoidable, and our responses to them are just as important.
We need to remember that over the long run, stock prices generally follow earnings. However, in the short term, investor overreactions to bits or even just hints of information can cause tremendous volatility. October was the fourth worst October since 1950 for the markets2 , and as of this writing, it is likely that the fourth quarter of 2018 (Q418) will rank among the five worst Q4s since 1950. If the current market selloff presages an impending recession, like the Q4s of 1973 and 2000, next year could be a challenging year for investors.
A more probable scenario is like most of the other lousy Q4s, which were not associated with the beginning stages of recessions. Q4s in 1957, ’78, ’87, and 2008 ranged from -5.73% to -23.23, but all the following years saw double-digit positive returns3. It does not appear that our economy is headed to recession in 2019. It could happen, but the signs simply don’t point to an imminent recession.
What we see in the global economic environment as we enter 2019 is slowing of the growth from early in 2018. That slowing and uncertainty about global trade and FED decisions, compounded by an intentionally disruptive Twitter campaign, contribute to current volatility. According to Dr. David Kelly, Chief Global Strategist at J.P. Morgan, there is little to indicate a stall, “inflation is extraordinarily stable.” Rapidly rising inflation is typical at the end of an expansion, and that is not happening now.
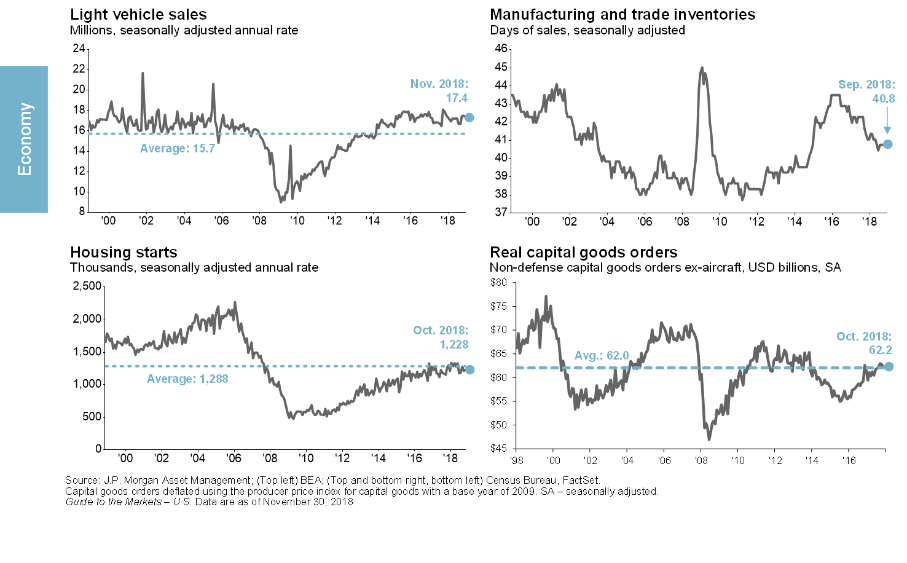
Just as important, there is no cyclical sector in an overextended position, according to Dr. Kelly. The cyclical sectors tend to perform best when economies expand, and they get hurt the most during recessions. Automobile sales is a great example. People worried about their future income don’t go out and buy new cars, but as the attached chart shows, vehicle sales remain above their 20-year average rates.
One cause of slowing down with age is that it takes longer for old bodies to recover from the hard workouts that we must do to stay fast. Stock market corrections are not unlike those hard workouts. As the expansion ages, corrections can take longer and become more volatile due in part to the added anticipation of its ultimate demise.
Only time will tell if the 4Q18 downturn signals the market’s prediction of an oncoming recession. Forecasts of recession are easy to make but virtually impossible to prove with accurate timing. Moreover, misfiring on the timing could be ruinous to long-run returns. So, we continue to recommend diversification, persistent monitoring, and routine adjustments to navigate this soon-to-be uncharted territory.4
As always, contact us with any questions or concerns.
As an added resource, about the middle of every quarter, we post LPL Financial’s “Recession Watch Dashboard” on our website. Click Here to see it or copy and paste the following URL into your browser.
https://enduringwealth.wpmudev.host/blog/2018/11/08/recession-watch-third-quarter-2018/
1The opinions voiced in this material are for general information only and are not intended to provide specific advice or recommendations for any individual. All performance referenced is historical and is no guarantee of future results. All indices are unmanaged and may not be invested into directly.
2As measured by the S&P 500 Index. The Standard & Poor’s 500 Index is a capitalization weighted index of 500 stocks designed to measure performance of the broad domestic economy through changes in the aggregate market value of 500 stocks representing all major industries.
3Yahoo! Finance
4The economic forecasts set forth in this material may not develop as predicted and there can be no guarantee that strategies promoted will be successful..
TRACKING #1-805505